Platform
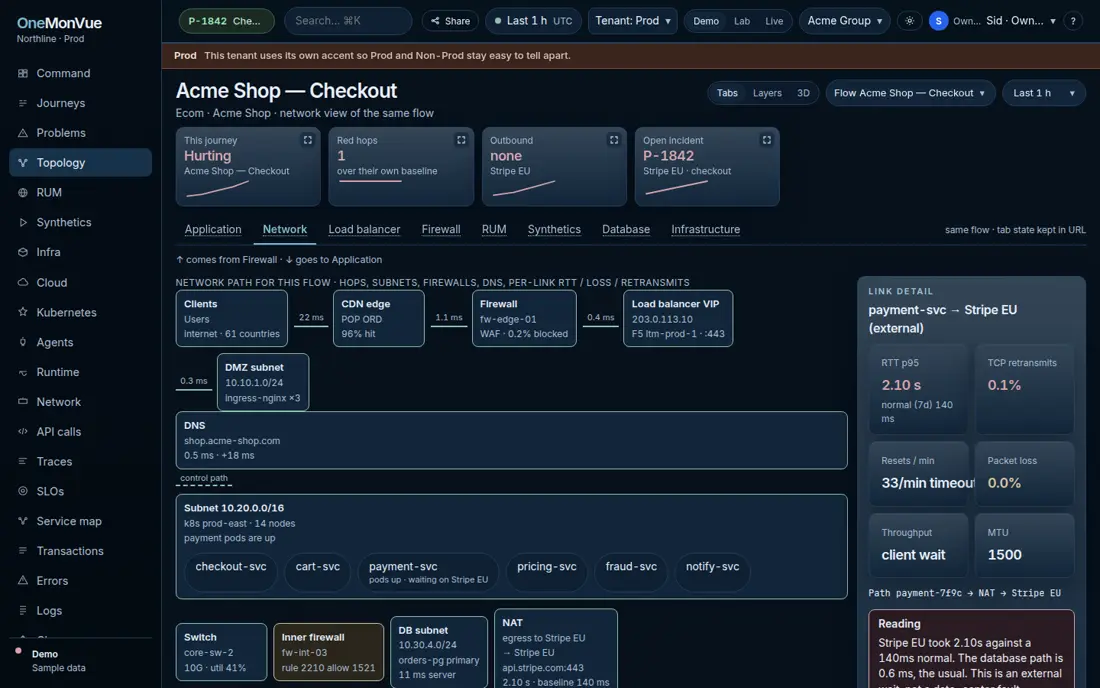
Flows, traces, and the network path.
Inbound hops and the outbound hop sit on one picture, with a table that says where the time went, what happened, and why.
Both directions
Shoppers come in through the CDN, the firewall, and the load balancer. The outbound hop leaves payment-svc through NAT to Stripe EU. The link detail keeps the database path at its usual time, so the wait is the external call. The hint on that view says traffic comes from the firewall and goes to the application.
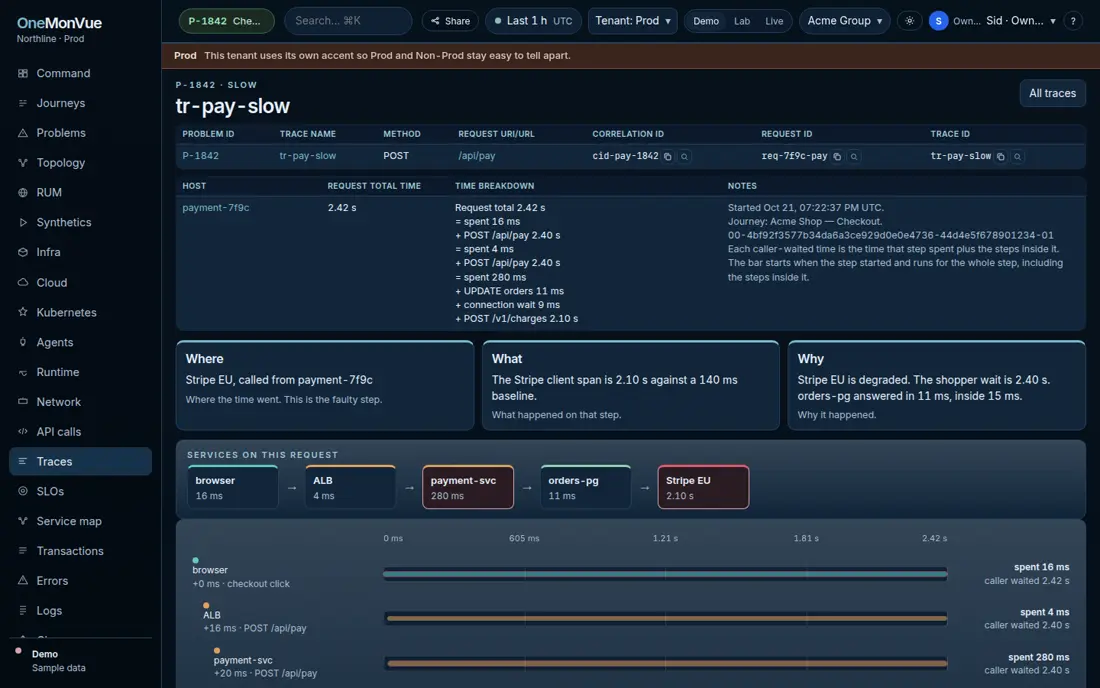
Where, what, and why
The trace header is a table: service, endpoint, where the time went, what happened, and why. On tr-pay-slow the slow step is the one marked. The waterfall is still there when you want the span.
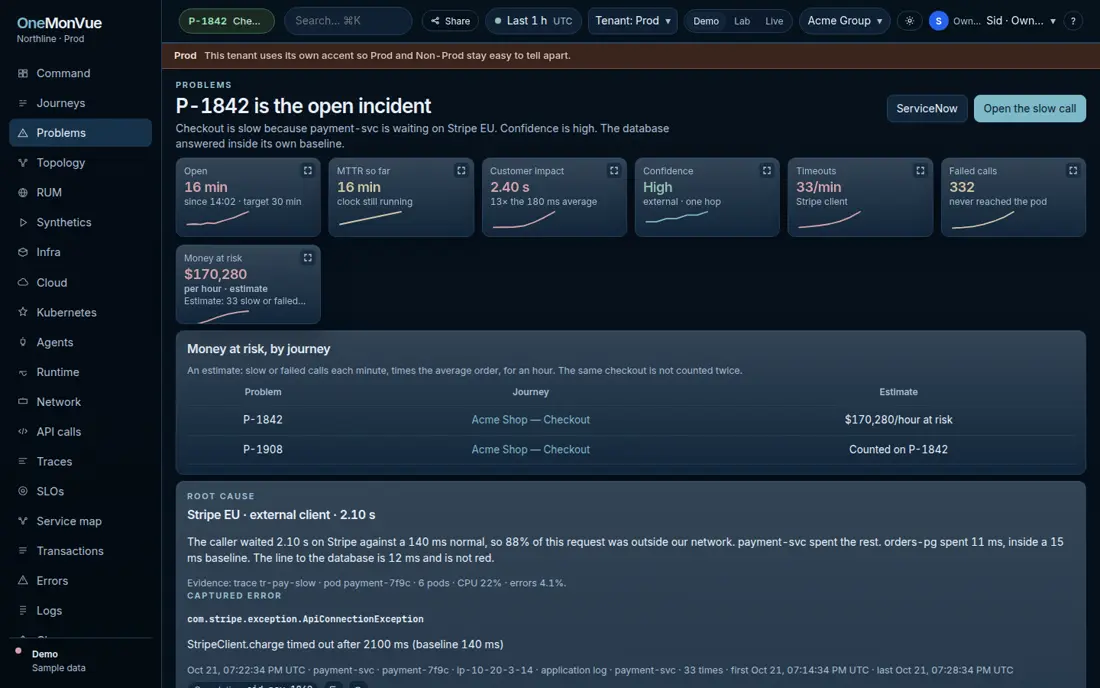
One open incident
Problems opens on P-1842, the open checkout incident. The row names the journey and where to look. A quiet database is part of the answer: the wait is not there.
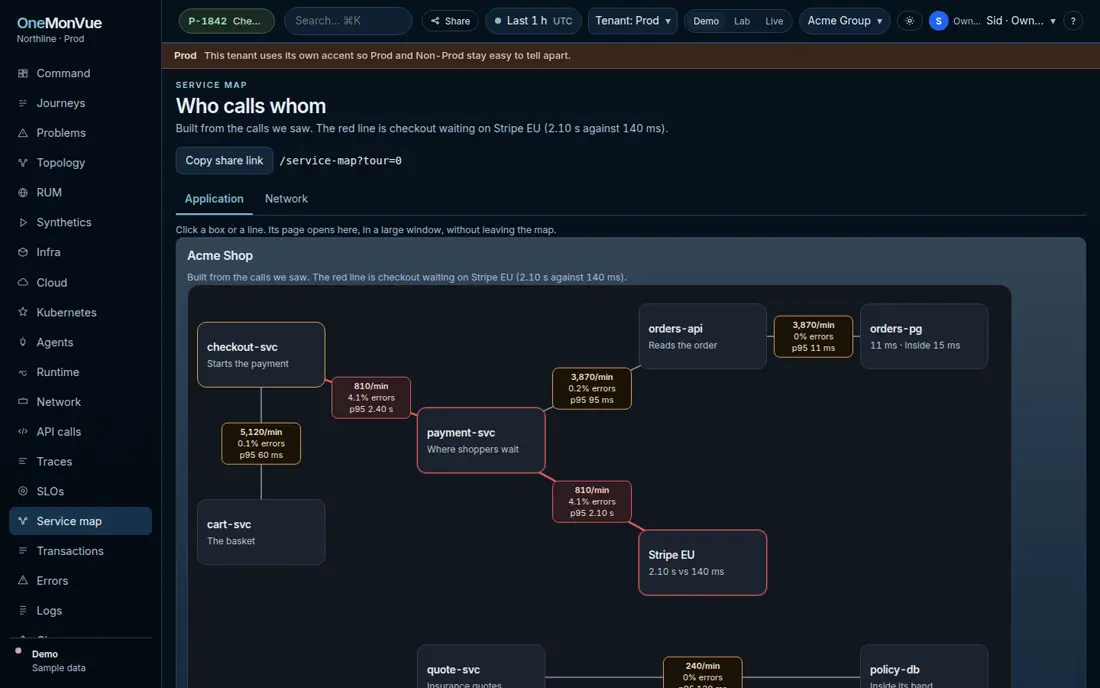
Who calls whom
The service map is the estate on one picture. Call stats stay off the node names so the picture stays readable.